Graph
The Graph element is one of the most powerful elements available to you because you can use it to create your own custom elements.
There are 3 values you'll need to supply the Graph Element. They are:
- Size of the canvas in pixels
- The lower left (x,y) coordinate of your coordinate system
- The upper right (x,y) coordinate of your coordinate system
The Graph element simplifies drawing and working on a drawing surface. In most SDKs, you're forced to work in a coordinate system that's dictated to you. For example, (0,0) is always located in the upper left corner. PySimpleGUI simplifies this problem by allowing you to locate (0,0) anywhere you want. You're also not limited to addressing pixels, you'll be working in whatever units you want with PySimpleGUI doing the math to translate your coordinate system into the underlying GUI framework's coordinate system.
For example, maybe you want to have (0,0) in the center and your coordinates go from (-2,-2) in the bottom left to (2,2) in the upper right. Not only can you work in this coordinate system you've defined, the underlying size can vary, allowing you to scale up/down your drawing to find the ideal size for you. If you want this drawing to be on a 500 x 500 pixel area, then it's 1 parameter to specify this. Changing it later to a 200 x 200 pixel area is done by changing the parameter you set to 500x500 previously. The rest of your code remains unchanged.
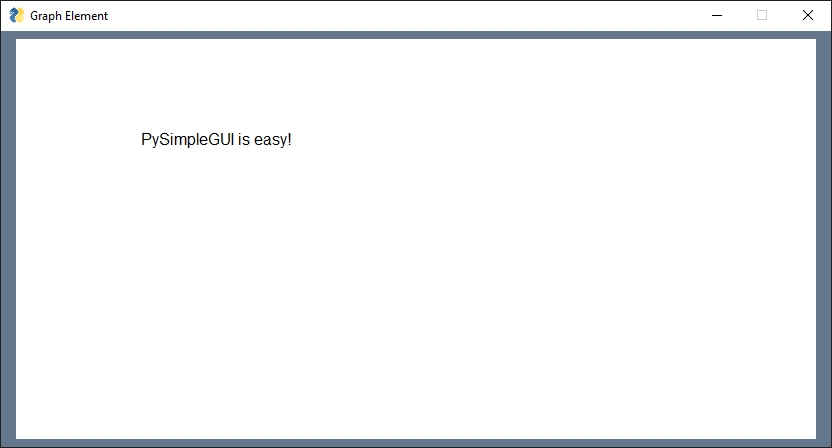
layout = [[sg.Graph((800, 400), (-400, -200), (400, 200), background_color='white', key='-GRAPH-')]]

# Window
window = sg.Window(title='Graph Element', layout=layout)
# Allows you to modify the graph before a window.read() call
window.finalize()

# Add text to the graph
window['-GRAPH-'].draw_text('PySimpleGUI is easy!', (-200, 100), font=14)
Events
There are numerous events that a Graph element can generate. All of them originate with the movement or clicking of a mouse.
Values Dictionary
The Values Dictionary for a Graph element is an (x,y) location of the event or the mouse cursor.
Drawing Primitives
You "draw" on your Graph element using drawing primitives.
After you create your Graph those values you can draw using class methods that you'll find in the call reference. They look something like these:
- draw_circle
- draw_line
- draw_point
Drawing primitives return "Figures". These figures are later used to identify and modify them.