Single Matplotlib Plot
This is your basic simple Matplotlib example
What's nice about this demo is that it shows all of the parts required and each section is tiny
You will paste your Matplotlib code at the top. The important thing to do is leave your drawing in a variable named fig
There is a "helper" function in the middle.
The bottom portion of the file is your GUI. There is only 1 line of code needed to take your Matplotlib drawing and place it into your GUI window. It is the call to draw_figure.
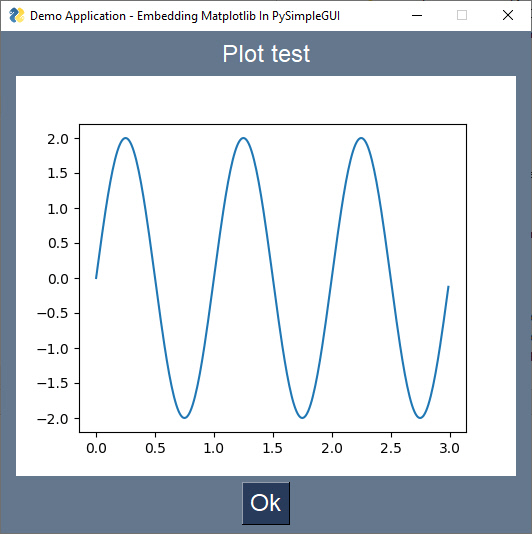
This is how your window looks on Windows: