Visualizing sorts
This demonstration shows how to use PySimpleGUI's Graph Element's drawing primitives to create a simple animation.
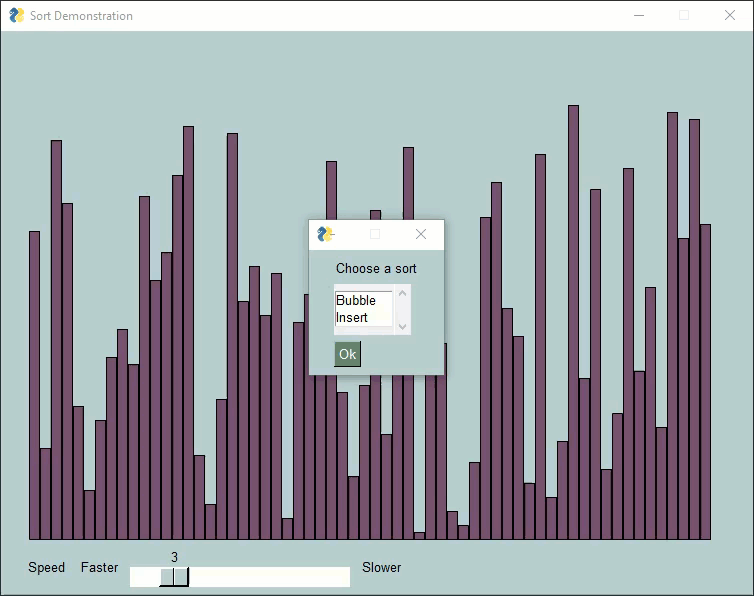
In this case a Bubble Sort and an Insert Sort are shown. Other sorting algorithms can be easily added. You can adjust the speed in realtime by using the slider.
This is how it looks on Windows:
Here on Trinket the animation may not be as smooth