Graphing with Graph Element
Use the Graph Element to draw points, lines, circles, rectangles using your coordinate systems rather than the underlying graphics coordinates.
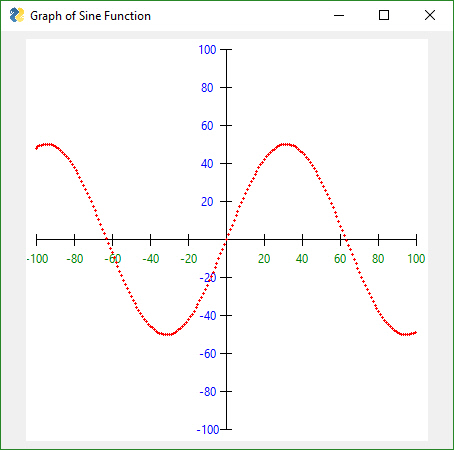
In this example we're defining our graph to be from -100, -100 to +100,+100. That means that zero is in the middle of the drawing. You define this graph description in your call to Graph.
import math
import PySimpleGUI as sg

layout = [[sg.Graph(canvas_size=(400, 400), graph_bottom_left=(-105,-105), graph_top_right=(105,105), background_color='white', key='graph', tooltip='This is a cool graph!')],]

window = sg.Window('Graph of Sine Function', layout, grab_anywhere=True, finalize=True)
graph = window['graph']

# Draw axis
graph.DrawLine((-100,0), (100,0))
graph.DrawLine((0,-100), (0,100))

for x in range(-100, 101, 20):
    graph.DrawLine((x,-3), (x,3))
    if x != 0:
        graph.DrawText( x, (x,-10), color='green')

for y in range(-100, 101, 20):
    graph.DrawLine((-3,y), (3,y))
    if y != 0:
        graph.DrawText( y, (-10,y), color='blue')

# Draw Graph
for x in range(-100,100):
    y = math.sin(x/20)*50
    graph.DrawCircle((x,y), 1, line_color='red', fill_color='red')

event, values = window.read()