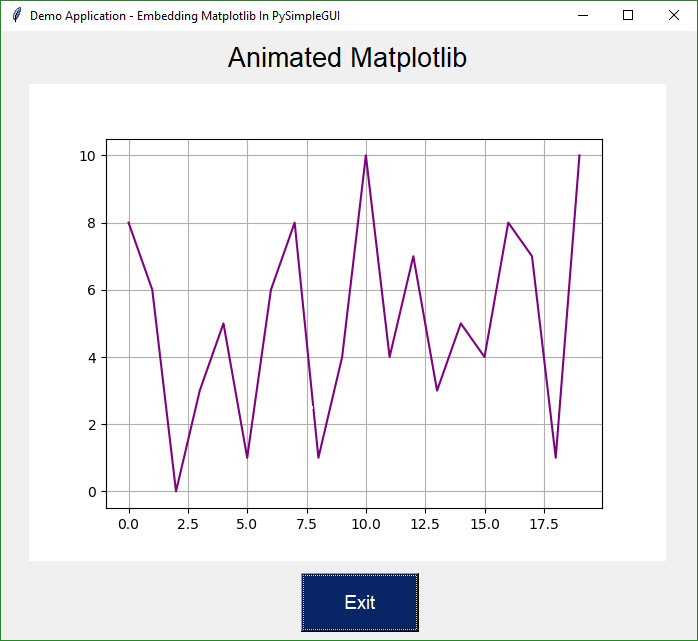
Animated Matplotlib Graph
Use the Canvas Element to create an animated graph. The code is a bit tricky to follow, but if you know Matplotlib then this recipe shouldn't be too difficult to copy and modify.
from tkinter import *
from random import randint
import PySimpleGUI as sg
from matplotlib.backends.backend_tkagg import FigureCanvasTkAgg, FigureCanvasAgg
from matplotlib.figure import Figure
import matplotlib.backends.tkagg as tkagg
import tkinter as Tk

fig = Figure()

ax = fig.add_subplot(111)
ax.set_xlabel("X axis")
ax.set_ylabel("Y axis")
ax.grid()

layout = [[sg.Text('Animated Matplotlib', size=(40, 1), justification='center', font='Helvetica 20')],
          [sg.Canvas(size=(640, 480), key='canvas')],
          [sg.Button('Exit', size=(10, 2), pad=((280, 0), 3), font='Helvetica 14')]]

# create the window and show it without the plot


window = sg.Window('Demo Application - Embedding Matplotlib In PySimpleGUI', layout, finalize=True)
# needed to access the canvas element prior to reading the window

canvas_elem = window['canvas']

graph = FigureCanvasTkAgg(fig, master=canvas_elem.TKCanvas)
canvas = canvas_elem.TKCanvas

dpts = [randint(0, 10) for x in range(10000)]
# Our event loop
for i in range(len(dpts)):
    event, values = window.read(timeout=20)
    if event == 'Exit' or event == sg.WIN_CLOSED:
        exit(69)

    ax.cla()
    ax.grid()

    ax.plot(range(20), dpts[i:i + 20], color='purple')
    graph.draw()
    figure_x, figure_y, figure_w, figure_h = fig.bbox.bounds
    figure_w, figure_h = int(figure_w), int(figure_h)
    photo = Tk.PhotoImage(master=canvas, width=figure_w, height=figure_h)

    canvas.create_image(640 / 2, 480 / 2, image=photo)

    figure_canvas_agg = FigureCanvasAgg(fig)
    figure_canvas_agg.draw()

    tkagg.blit(photo, figure_canvas_agg.get_renderer()._renderer, colormode=2)